Based on your show design and with barely any incremental effort required on your part, Finale 3D provides pro-forma sound level charts showing the expected sound levels over the course of the show, and site layout diagrams showing the maximum sound levels expected to be reached at designated locations of interest, such as nearby residences or audience locations. You can use these tools to manage sound levels in your designs and communicate options with your clients or authorities having jurisdiction:
- Design a show to fit within the sound level restrictions of the venue.
- Provide clients with options.
- Be able to manage sound levels for environmental impact.
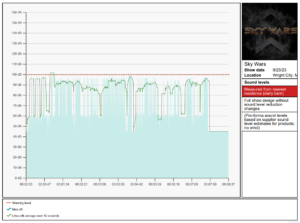
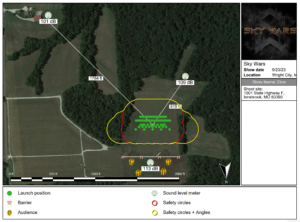
An example sound level chart is shown in Figure 1, along with a matching site layout diagram in Figure 2. The sound level chart is generated for a designated measurement location of a residential barn near the shoot site, which you can see in the upper left of the site layout diagram. The site layout diagram contains three sound meter elements, which show the maximum expected sound levels at the barn and two other locations. You can see from this diagram that the maximum sound level at the barn is a little over 100 dB, which corresponds to the highest peak in the sound level chart.

Figure 1 – Example sound level chart
Adding sound meter elements to a site layout diagram is just like adding an audience icon: choose “Sound meters” from the “Draw mode” link in the upper left of the site layout view, and then click-and-drag the sound meters to your locations of interest. The only difference between a sound meter element and an icon is that the sound meter elements include a dynamic label showing the maximum sound level in decibels at that location.
The sound level calculations in the site layout diagram are based on sound specifications of the effects used in the show design, the same specifications that sound charts are based on. These specifications do require some setup. For instructions to make site layout diagrams, see Site layout diagrams basic instructions. For instructions to set up the effect sound specifications, the paragraphs below include everything you need to know.

Figure 2 – Site layout diagram with sound level meter elements showing maximum sound levels at their locations
Sound specifications of effects
Just as the visual simulation of the show is based on simulations of the individual effects, the sound level simulation of the show is based on sound level specifications of the individual effects. The sound level specifications can come from three places:
- Specifications in supplier catalogs, from measurements conducted by the suppliers or manufacturers of the effects
- Default specifications from Finale 3D, based on measurements of effects of various types
- Specifications that you enter yourself, based on your own measurements
The supplier catalog sound level specifications will be great when they become available, but at the time of this writing (early 2024) the Finale 3D sound level features have just been released in the software beta versions and no supplier catalogs with sound levels are available yet. Look for upcoming announcements from suppliers, and for some suppliers offering “low decibel” effects that can be used in sound sensitive environments, analogous to “low debris” effects used in debris sensitive environments.
Default specifications from Finale 3D are easy to generate and adequate for many purposes. After designing your show, select the Per-Show Effects collection in the effects window and then choose the main menu item, “Effects > Sound levels > Set effect sound levels to defaults…” and choose “All” in the dialog that pops up. That function will generate and apply default sound level specifications to all the effects used in the show, based on their VDL and Type and Size. The sound specifications are based on whether the effects are hard breaking, soft breaking, salutes, comets, or mines. Default cake sound specifications come from the VDL firing patterns and the effect components used in the cake.
If you can acquire your own measurements, you can add them to your effect definitions in any of the effect collections: the Per-Show Effects, My Effects, or network inventories. Right-click on an effect in the effects window and select the context menu item, “Set physical specifications…” Enter the decibel level of the launch and/or break impulse and the distance (on the ground) at which the measurement was taken. Comets and mines generally have only launch sounds; breaking shells have both launch and break sounds.
Sound specifications of cakes and chains
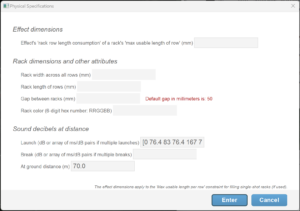
Cake sound specifications are represented with a pair of numbers for each shot of the cake. In the dialog from “Set physical specifications…” (see Figure 3), the launch and break fields can contain either a single number, indicating the decibels at distance of the effect, or a list of numbers representing the sound levels of all the shots of the cake. The syntax of the list of numbers is:
[timeOffsetMs_0 decibels_0 timeOffsetMs_1 decibels_1 timeOffsetMs_2 decibels_2 ... ]The millisecond time offsets in the launch field are relative to the ignition of the cake. Thus if a cake had 10 shots over a total firing duration of 4.5 seconds, the time offsets would be 0, 500, 1000, 1500, 2000, 2500, 3000, 3500, 4000, 4500. If the shots were all 100 decibels, the full specification in the launch field would be,
[0 100.0 500 100.0 1000 100.0 1500 100.0 2000 100.0 2500 100.0 3000 100.0 3500 100.0 4000 100.0 4500 100.0]

Figure 3 – Cakes have sound impulses for the shots, each represented as a time offset and decibel level.
The syntax for specifying multiple sound impulses can be employed for any effects. A stutata shell, for example, could have multiple sound impulses in the break field to represent the subshell salutes. The time offsets in the sound specifications in the launch field are relative to the launch of the effect or ignition of the cake; the time offsets in the break field are relative to the time of the initial break, which is the launch time plus the lift time.
Unlike for cakes, the sound specifications for chains should represent only the first shell, and therefore generally do not require a list of sound impulses. When chains are inserted into a show from an effects collection, the chains are expanded to multiple events in the script, which are then grouped together into a single row to give the appearance in the script that the chain is a single item. Notwithstanding, the chain shells are each individual rows in the script, each with its own sound impulses for launch and break.
Creating a sound level chart
The steps to create a sound level chart are,
- Add sound specifications for the effects in the show. See the instructions above or just select the Per-Show Effects collection in the effects window and do, “Effects > Sound levels > Set effect sound levels to defaults…”
- Choose the location represented by sound level chart by right-clicking on the terrain in the design view and selecting the context menu item, “Coordinates for this point….” and then doing, “Show > Show settings > Set sound level chart measurement location…”
- Customize the information in the panels on the right side of the diagram by doing, “Show > Set side panel text… > For printed charts“.
- Print the chart with the menu item, “File > Charts > Sound Level”.
Customizing the sound level chart
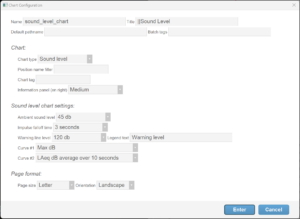
Like reports and diagrams, the charts are based on template blueprints. You can choose the chart settings for a particular chart by editing the chart template. From the blue gear menu in the upper right of the script window, choose “Create or edit chart template”, which will pop up the dialog shown in Figure 4.

Figure 4 – The blueprint for sound level charts includes a few sound customizations in addition to generic chart customizations.
All printed documents have an option to specify the Default pathname for Print batch (along with the batch tags) or just to make the save dialog pop up with the convenient directory or filename. The Position name filter provides the capability to create a chart based on sound levels of effects at a subset of the positions. The chart tag is analogous to Diagram tags.
The ambient sound level default value of 45 dB is the sound level of a quiet room. As context, a sound level of 65 dB is the level of a normal conversation across the dinner table. A sound level of 100 dB is the sound level of raucous applause from within the audience. A sound level of 110 dB is the sound level of a rock concert from the front row. Fireworks get even higher than that, sometimes 120 dB at viewing distance or higher yet for fireworks crew that are igniting shells by hand.
The optional impulse falloff time applies a “time weighting” window to the impulses in the effect’s sound level specifications. The impulses from fireworks are of extremely short duration, measured in microseconds or single-digit milliseconds, yet physical and perceptual factors can make the impulses appear wider. The impulse falloff time adjusts the simulation to make the impulses appear as wider spikes in the chart.
The warning line is simply a horizontal dotted red line drawn across the chart at a decibel level you designate. The line has no meaning other than the meaning you give to it. Depending on your purpose for the sound level chart, you might for example use the warning line to indicate the threshold your show design strives to stay under. You can change the label of the warning line in the legend to be any explanation you want.
The sound level chart can display two curves, which by default are the instantaneous sound level, and the average continuous sound level equivalent over a 10 second averaging window. The instantaneous sound level is called the sound pressure level or SPL or LAmax (fireworks measurements are usually presented with the “A” frequency weighting). The average sound level is called the LAeq. The chart can display one or both of these curves.
Where the information displayed in the chart comes from
The information that goes into the curves and side panels of the sound level chart shown in Figure 1 comes from a variety of places. Table 1 provides a reference.
Table 1 – Where the sound level chart information comes from
| Information source | How the information is incorporated in the sound level charts |
| “Show > Set show information…” main menu item | Show name, location, company logo, and other information automatically included in the information panel |
| “Show > Show settings > Set sound level chart measurement location…” main menu item | Choose the XYZ location on the shoot site that the chart will represent (right-click on the ground in the design view and select “Coordinates of this point…” to see the XYZ coordinates of any point in the shoot site) |
| “Set physical specifications…” context menu for effects in the Per-Show Effects collection in the effects window | Decibel at distance sound specifications of the effects, which go into the calculation of the curves in the chart |
| “Show > Set side panel text… > For printed charts” main menu item | Text that goes into the information panel boxes, and formatting of the text |
| Sound level chart blueprints (from blue gear menu in upper right of script window, “Create or edit chart template”) | Formatting template with various chart options |
